
Project
Here are some of the real-world dashboards, automation tools, and data reports I’ve built using Power BI, Excel, and SQL.
Title: My CV in Power BI
Description: An interactive resume built in Power BI to showcase my experience, skills, and education using slicers, visuals, and KPIs.
Tools: Power BI
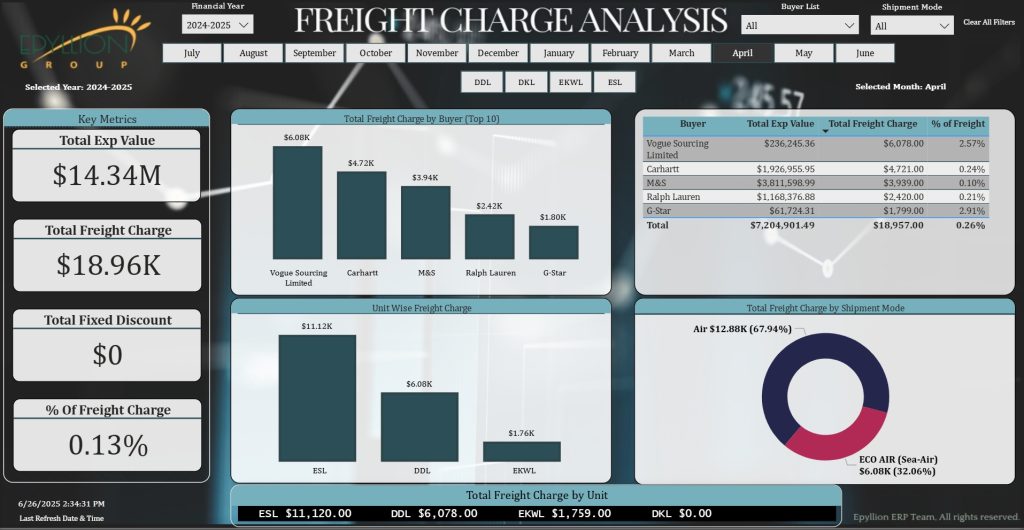
Title: Freight Charge Analysis Dashboard
Description: A Power BI report to track and visualize freight costs across vendors and destinations — helps reduce unnecessary shipping expense.
Tools: Power BI, Excel
Title: Export Dashboard
Description: Visualizes export performance across buyers, styles, shipment status, and country-wise distribution. Tracks shipment timelines, export value trends, and delivery performance to improve export planning and coordination.
Tools: Power BI, Excel, ERP, SQL

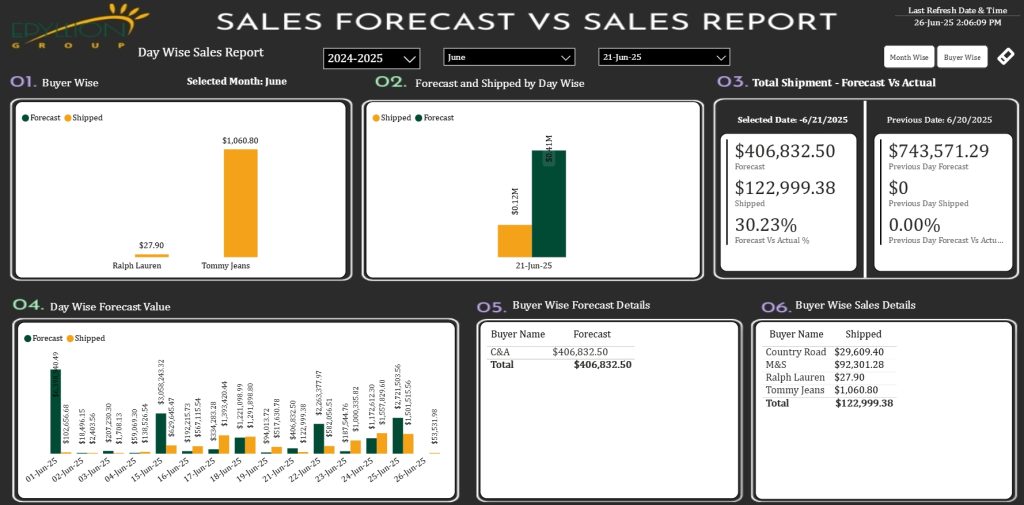
Title: Sales Forecast vs Actual Report
Description: Compare sales forecasts with actual sales to measure accuracy, identify gaps, and improve future planning.
Tools: Power BI, Excel
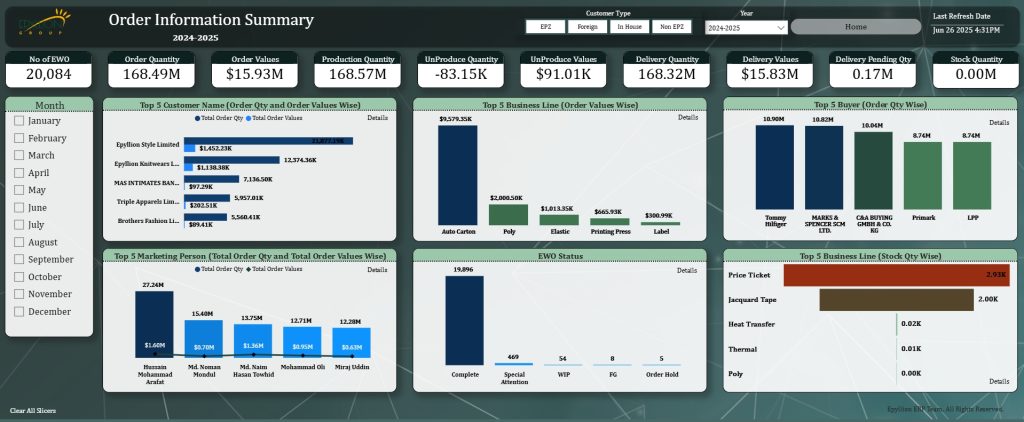
Title: EPL Order Summary
Description: High-level order summary by buyer, style, and factory with real-time progress tracking.
Tools: Power BI, SQL
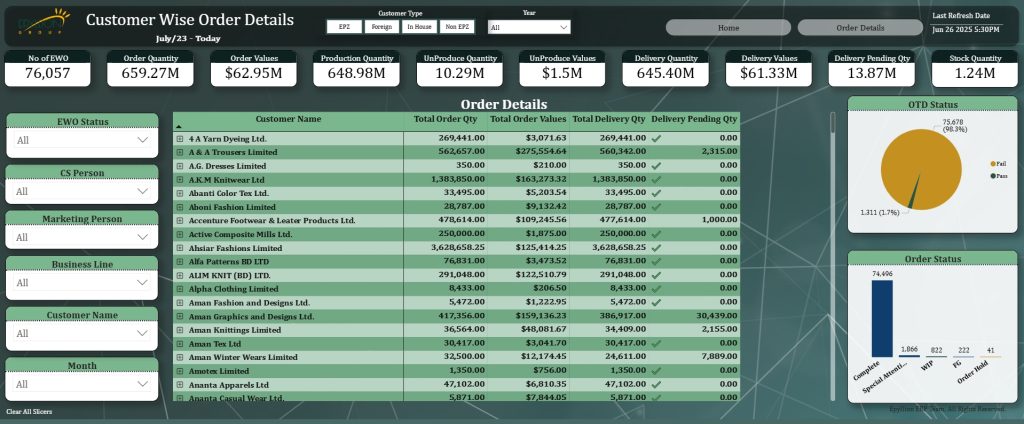
Title: EPL Order Details Dashboard
Description: Displays order-wise production, shipment, and delivery status across EPL units.
Tools: Power BI, Excel, SQL
🔔 Note: All dashboards listed above are shared in PDF format for quick viewing. If you’d like to see live Power BI versions, feel free to contact me.